![Logo_quer_farbig.png]](https://docs.sentinum.de/hs-fs/hubfs/Logo_quer_farbig.png?height=40&name=Logo_quer_farbig.png)
- Version History
- General Warnings and Safety Instructions
- General Information
- Features
- MID Approval for Billing Purposes
- Display Operation
- Accuracy in Photovoltaic Systems
- Current Transformers
- Measurement Values on the Display
- Wireless Communication
- LoRaWAN® and mioty® Base Stations
- Operation of LoRa® and mioty ® networks
- Technical Features
- Product Information
- Safety Instructions
- Customer Responsibilities
- Scope of Delivery and Inspection upon Receipt
- Installation and Commissioning
- Measurement Method
- Operating Concept
- Overview: Front View of Hyperion
- Overview of the Hyperion Display
- Compatible Devices
- Installation
- Safety Instructions
- Commissioning / Inspection
- Factory Default Settings
- Wiring Diagram: Direct Connection (3-Phase)
- Wiring Diagram: Direct Connection (1-Phase)
- Tightening Torque
- Spring Clamp Terminals: Strand Cross-Section
- Operation
- Main Menu Pages
- Submenu Pages
- Power and Power Consumption
- Voltage, Power Factor, and Frequency
- Configuration Settings
- Basic Settings
- Transformer Ratio Settings
- Additional Settings
- M-Bus Wiring Diagram
- Additional Configurations, Communication, and Diagnostics
- LoRa® Factory Settings
- mioty® Factory Settings
- Error Conditions
- Advanced Information on Load Profiles According to PTB-A 50.7
- Measurement Accuracy Notes
- Error Messages / Time Adjustments
- Power Outage and Restart
1. Version History
| Version | Date | Change |
|---|---|---|
| 1.0.0 | Jan. 9, 2025 | Created |
| 1. 0.1 | March 25, 2026 |
|
2. General Warnings and Safety Instructions
Warnings and important information about potential hazards or possible damage.
Important information required for the proper operation of the devices .
- Follow the safety instructions and installation guidelines in the manual and the installation checklist.
- Ensure that the installation environment complies with the specified operating range guidelines. Always adhere to temperature and other limit values.
- The device may only be used within the ranges specified in the technical specifications.
- The device may only be used for the purposes described.
- Safety and functionality can no longer be guaranteed if the device is modified or expanded.
- The sensor must not be mounted on ceilings or floors.
- Operation of the sensor is permitted only up to a maximum altitude of 2,000 m above sea level.
- Operation is permitted only in rooms with a maximum ceiling height of 2 m.
- Due to human exposure regulations, a minimum distance of 20 cm must be maintained between the device and people.
- Ensure that the installation environment complies with the prescribed guidelines for the respective application.
- Adhere to all temperature, humidity, and operating limits at all times.
If the device is installed incorrectly:
- It may not function properly.
- It may be permanently damaged.
- It may pose a risk of injury.
- Improper handling, such as excessive mechanical stress or dropping the device, can lead to damage.
- If battery cells other than those recommended are used, performance, runtime, and product safety may be negatively affected.
- The device may only be installed and put into operation if it has been removed from the original packaging undamaged. Immediately after removal, a visual inspection for for damage. If the product is damaged, it must not be put into service.
3. General Information
- The Hyperion is a multifunctional, bidirectional energy meter that is only 90 mm (5 TE) wide and offers high flexibility and accuracy.
- Via direct or current transformer connection, it supports the analysis and monitoring of a wide variety of parameters in residential, commercial, and industrial applications.
- It combines the functions of an energy meter with those of a data logger and provides additional measurements such as current, voltage, and power.
- Depending on the device variant, data transmission is via mioty® or LoRaWAN®.
3.1. Features
- Bidirectional meter (Supply and consumption)
- MID B + D certification for billing purposes (3-phase operation only)
- Mechanical environmental conditions: M2
- 1- and 5-A current transformer connection for up to 20,000/5 A or 4,000/1 A. The transformer ratio can be configured multiple times using sealable buttons.
- Direct connection up to 100 A
- 2- or 4-rate operation (configurable on the meter)
- Heavy-duty Opto Power MOSFET
- S0 pulse output, 5 to 60 V AC/DC
- Graphical LC display (38 × 28 mm) with backlight
- Dynamic 8-digit display with up to three decimal places
- mioty® or LoRaWAN® wireless interface
3.2. MID approval for billing purposes
The Hyperion has been tested and approved in accordance with MID Modules B + D (Measurement Instruments Directive 2004/22/EC of the European Commission)
The device therefore has the necessary declaration of conformity. Thanks to the additional certification under Module D for manufacturing and final inspection, all Hyperion energy meters can be used ex works for billing purposes within the European Union and the European Economic Area (EEA).
3.3. Display Operation
A 38 × 28 mm backlit graphical LCD display allows measurement values and settings to be read even under difficult lighting conditions.
The desired menu language can be selected using the control buttons. The clear and intuitive operation simplifies commissioning as well as daily work with the energy meters.
3.4. Accuracy in Photovoltaic Systems
The Hyperion has been specifically tested for use with inverters in photovoltaic systems. This additional testing ensures accurate measurement results in the unregulated frequency range between 2 kHz and 150 kHz.
In this context, renowned trade journals report measurement errors of up to 18% when using unsuitable measuring instruments.
4. Current Transformers
With the Hyperion, the current transformer ratio can be configured multiple times via the control buttons from 5/5 to 20,000/5 A or from 1/1 to 4,000/1 A, in accordance with MID certification can be configured multiple times via the control buttons from 5/5 to 20,000/5 A or from 1/1 to 4,000/1 A. The sealable service button protects against tampering. In addition, configuration changes are logged and archived.
Highlights
- MID B + D approval
- Bidirectional meter
- Certification of frequency-independent metering mechanism in the range from 2 kHz to 1 50 kHz
- Integrated tamper detection
| Measured Value | Total / 3 Phases | Per Phase | Per Rate |
|---|---|---|---|
| Active Energy Consumption (kWh) | ✓ | ✓ | ✓ |
| Active energy consumption (kWh) | ✓ | ✓ | ✓ |
| Reactive energy consumption (kvarh) | ✓ | ✓ | ✓ |
| Reactive energy supplied (kvarh) | ✓ | ✓ | ✓ |
| Active power (kW) | ✓ | ✓ | - |
| Reactive power (kvar) | ✓ | ✓ | - |
| Apparent power (kVA) | ✓ | ✓ | - |
| Current (A) | ✓ | ✓ | - |
| Voltage (V) L-N | - | ✓ | - |
| Voltage (V) L-L | - | ✓ | - |
| Power Factor (Cos Phi) | - | ✓ | - |
| Frequency (Hz) | ✓ | - | - |
| Number of power outages | ✓ | - | - |
| Load profile storage | - | - | ✓ |
4.1. Measured Values on the Display
The table of available measured values is not exhaustive. Additional measured values are continuously being integrated and made available via both the graphical display and the data output interface.
Features
- Logbook for events relevant to metrology and configuration changes
- Changes to the time or date
- Changes to the current transformer ratio
- Changes to the pulse rate and pulse duration
- Change in voltage transformer ratio
- Buffered internal clock
The internal clock is buffered in the event of a power outage. The load profile is saved every 15 minutes. The saved data can be read via the interface or viewed directly on the display.
5. Wireless Communication
5.1. LoRaWAN® and mioty® wireless interfaces
LoRaWAN® and mioty® wireless technologies enable communication between meters, sensors, and actuators via unlicensed radio frequencies. Both technologies were developed specifically for the Internet of Things (IoT) and are designed for long ranges combined with high transmission reliability.
The Hyperion optionally features an integrated LoRaWAN® wireless interface. The device is designed as a Class -C device and can therefore receive LoRaWAN® commands at any time. The measured values to be transmitted are freely configurable and can be flexibly adapted to the respective requirements.
The mioty® version currently supports only uplink communication and cannot receive downlink messages.
5.2. Operation of LoRaWAN® and mioty® Networks
The Hyperion energy meter can be operated in:
- existing LoRaWAN® or mioty® networks
- self-operated LoRaWAN® or mioty® networks
- mioty® networks provided by DIEHL
This also enables cost-effective operation of your own LoRaWAN® or mioty® networks.
5.3. Technical Features
- Internal antenna optimized for the 863 to 870 MHz frequency range
- Optional model with SMA connector for external antennas
- Transmit power of up to 14 dBm
- Class C device, can also be operated as a Class A device
- Automatic time synchronization via the LoRaWAN® network
- Support for OTAA and ABP as join procedures
- Flexible configuration of the content and interval of uplink messages
- Decoders and encoders already stored in The Things Network
- Free availability of decoders and encoders for third-party applications
- Status display for LoRaWAN® and mioty® on the LCD
6. Ordering Information and Product Information
6. 1. Ordering Information
| Model | Type | Part No. |
|---|---|---|
| Hyperion Energy Meter with direct measurement up to 100 A | LoRaWAN®, internal antenna | S-HYPE-LOEU-D-INT |
| Hyperion Energy Meter with direct measurement up to 100 A | LoRaWAN®, external antenna | S-HYPE -LOEU-D-EXT |
| Hyperion Energy Meter with direct measurement up to 100 A | mioty®, internal antenna | S-HYPE-MIOTY-D-INT |
| Hyperion Energy Meter with direct measurement up to 100 A | mioty®, external antenna | S-HYPE-MIOTY-D-EXT |
| Hyperion Energy Meter with current transformer connection | LoRaWAN®, internal antenna | S-HYPE-LOEU-W-INT |
| Hyperion Energy Meter with current transformer connection | LoRaWAN®, external antenna | S -HYPE-LOEU-W-EXT |
| Hyperion Energy Meter with current transformer connection | mioty®, internal antenna | S-HYPE-MIOTY-W-INT |
| Hyperion Energy Meter with current transformer connection | mioty®, external antenna | S-HYPE-MIOTY-W-EXT |
3/100
3/5
6.2. Product Information
| Feature | Details |
|---|---|
| Active energy | Class B (1%) according to EN50470-3 Direct-connection meter Class B (1% ) per EN50470-3 Transformer-based meters |
| Reactive energy | Class 2 (2%) per EN62053 |
| Operating voltage | L-L: 400 VAC ±20 % L-N: 230 VAC ±20 % |
| Maximum current | Direct-reading meters: 100 A Transformer meter: 6 A |
| Inrush current | Direct-reading meters: 20 mA at power factor 1 Transformer-based meters: 1 mA at power factor 1 |
| Mains frequency | Nominal frequency: 50 Hz, 60 Hz upon request Threshold frequencies: 40 to 65 Hz |
| Power consumption | Voltage path: 0.8 VA / 0.8 W per phase Current path for transformer meters: 0.075 VA per phase |
| Current and voltage connections | Direct-reading meters: 1.5 to 35 mm², torque 2 Nm, max. 3 Nm Transformer meters: 1 to 6 mm², torque 0.8 Nm, max. 1 Nm |
| Rate switching | 2 - or 4-tariff operation (configurable on the meter) Tariff switching: 230 VAC |
| Current transformer ratios | On the Hyperion 3/5, the current transformer ratio can be configured in multiple ways. Current transformer /5 A: 5/5 A up to 20,000/5 A in 5-A - steps Current transformer /1 A: 1/1 A up to 4,000/1 A in 1-A steps |
| Display (LCD) | Dynamic 8-digit display with up to three decimal places Graphical LCD display with backlighting backlight Dimensions (W × H): 38 × 28 mm |
| S0 pulse output | Standard EN62053-31 Potential-free output Pulse rate per kWh/kvarh: 1, 10, 100, 1,000, or 10,000 pulses Pulse width: 2 ms, 10 ms, 30 ms, 40 ms, or 120 ms Pulse rate and pulse width adjustable on the meter |
| Optional data interfaces | LoRaWAN® or mioty® Optional with SMA connector for external antenna |
| Optical (IR) D0 interface | EN 62056-21 |
| Data retention | Storage in EEPROM, at least 10 years Optional: IOTA Tangle (blockchain technology) |
| Clock | Buffered clock (up to 18 days) Time synchronization via interfaces possible |
| Mounting / Installation | Orientation-independent On a 35-mm DIN rail or with a front mounting frame |
| Weight | approx. 350 g |
| Housing | Polycarbonate, halogen-free, recyclable Enclosure protection rating IP51, terminal protection rating IP20 Protection class II |
| Dimensions (L × W × D) | 90 × 91 × 72 mm 5 module widths |
| Approvals | CE and MID B + D PTB-A 20.1 PTB-A 50.7 Suitable for energy management according to ISO 50001 |
| Environmental Conditions | Me Mechanical: M2 Electromagnetic: E2 Operating temperature: -25 °C to +70 °C Storage temperature: -30 °C to +70 °C Relative humidity: Annual average 75%, 90% for short periods, non-condensing |
| Safety Notice | Electric meters must be installed exclusively by qualified electricians. Current transformers must not be operated while open, as dangerous voltages may occur. This can cause injury to persons and property damage. |
| Device Selection | To ensure the simplest possible maintenance or replacement (e.g., due to calibration validity), the requirements of the respective system should be taken into account when selecting the devices. |
Disclaimer
This documentation may contain forward-looking statements based on the current assumptions and assessments of company management. Such statements are identified as forward-looking by corresponding wording.
Forward-looking statements are not guarantees of future developments. The actual business performance of Sentinum GmbH and its affiliated companies may differ significantly from the expectations presented due to various risks, uncertainties, and external factors.
These factors include, in particular, changes in the economic environment and the behavior of competitors, market participants, or regulators. Many of these factors are beyond the direct control of Sentinum GmbH and cannot be reliably predicted.
There are no plans to update the forward-looking statements contained in this documentation. Sentinum GmbH assumes no separate obligation to do so.
7. Safety Instructions
Please carefully read this operating manual as well as all other documents provided by Sentinum GmbH.
When using the Hyperion energy meter, observe all safety regulations and warnings. Failure to do so may result in serious personal injury or property damage.
Use the Hyperion exclusively within the specified operating range. Exceeding the permissible limits may cause damage to persons or equipment. Unauthorized modifications to the device will result in the loss of any warranty claims.
All applicable safety , installation, and factory regulations must be observed. Installation of the Hyperion energy meter may only be performed by qualified and appropriately trained technical personnel.
The following symbols indicate different types of instructions and hazards:
This symbol describes important information, procedures, or handling instructions for the proper operation of the device.
This label indicates situations that could result in property damage, serious injury, or death.
Maintenance
The Hyperion is maintenance-free. In the event of damage—for example, due to incorrect connection or improper storage—repairs may be performed exclusively by Sentinum.
Disclaimer
The selection of the appropriate meter and the assessment of its suitability for a specific purpose are the sole the sole responsibility of the purchaser.
No liability or warranty is assumed for this selection. Information in catalogs and data sheets does not constitute a guarantee of specific product characteristics, but is based on empirical data and measurements.
Liability for damages resulting from incorrect operation, project planning, or malfunctions of the energy meter is excluded.
The operator or project planner must ensure that incorrect operation, incorrect project planning, or malfunctions cannot lead to further damage.
Sentinum GmbH assumes no liability for defects or damage resulting from improper use of the Hyperion energy meter or from failure to follow these operating instructions.
7.1. Customer Obligations
Data Backup and Backup Copies
Regardless of the type of installation of the Hyperion energy meter, the customer is solely responsible for data backup. The risks and costs of operation are borne by the customer.
As part of additional services, Sentinum may assist the customer in developing suitable concepts. The customer must perform the data readings and create backup copies, and must store them securely.
Monitoring Obligation
The customer is obligated to implement appropriate monitoring measures to ensure that a failure of metering points is detected immediately, or at the latest within 24 hours.
Access Permissions
The customer is responsible for protecting the Hyperion from unauthorized access through appropriate technical and organizational measures.
Responsibility for the IT Environment
The customer is responsible for its IT environment and for ensuring access. The customer acknowledges that the Hyperion energy meter and future firmware updates require certain system requirements.
The customer is solely responsible for meet these requirements and to provide the necessary hardware and sufficiently qualified personnel.
The customer must take appropriate measures in the event that the Hyperion energy meter fails to function properly, either in whole or in part. These include, for example:
- daily data backups,
- fault diagnostics,
- regular verification of measurement results,
- emergency and restart planning.
The infrastructure required for this, as well as the technical capabilities of the operating environment, are entirely the responsibility of the customer.
Since system requirements may change due to firmware updates or ongoing operation, the customer is obligated to regularly verify that the requirements continue to be met.
The Hyperion's data log entries must be read and archived daily.
7.2. Scope of Delivery and Incoming Inspection
Scope of Delivery
- A quick start guide containing the most important information about the Hyperion energy meter. Please read this carefully.
- A Hyperion energy meter.
If your shipment shows obvious damage, please contact us immediately via email. When doing so, please provide the serial number for each affected device as well as the corresponding delivery note or invoice number.
8. Further information on the design, product, measurement method, and use
8.1. Product Description
The Hyperion is:
- intended exclusively for use as a three-phase energy meter. MID compliance applies exclusively to three-phase operation.
- intended for the static three-phase measurement of active energy consumed and supplied in accordance with EN 50470-3:2006 in residential, commercial, and industrial environments.
- These measurements can be used for billing purposes.
- intended for the static three-phase measurement of reactive energy consumed and supplied in accordance with EN 62053 in residential, commercial, and industrial environments.
- These measurements can be used for billing purposes.
- Not MID-compliant in single-phase operation. The specified wiring diagram must be strictly adhered to.
- Suitable for installation in stationary, weather-protected control cabinets inside buildings.
- Suitable for use in four-wire systems and TN systems.
- The 3/100 variant is suitable for direct current measurements up to 100 A.
- Suitable for measurements in medium- and high-voltage networks only in conjunction with current and voltage transformers.
- The use of voltage transformers is not certified; the measured values are not legally valid for calibration purposes.
- Voltage transformers can only be set to a ratio of ../100.
- The 3/5 version is designed for current measurements via external ../1-A or ../5-A current transformers.
- Suitable for use in residential, commercial, and industrial applications.
- The LP version is certified for load profile measurements according to PTB-A 20. 1 and PTB-A 50.7.
The measurement data can be displayed on the screen and, depending on the device model, read out via the available interfaces and processed further.
8.2. Measurement Method
Current and voltage are measured continuously. The Hyperion measures current and voltage over a period of one second and then automatically starts a new measurement cycle.
During this measurement interval, the relevant electrical parameters are recorded and processed for the further calculation of energy, power, and status values.
- The Hyperion records 8,192 measurement points for voltage (U) and current (I). These measurement points have a resolution of 32 bits.
- All measured values for voltage (U) and current (I) are squared, summed, and then divided by the number of measurement points (8,192). The respective root mean square value is calculated from the square root of this result.
The root mean square (RMS) value of the voltage is calculated as follows:
Ueff = √((U₁² + U₂² + ... + U₈₁₉₂²) / 8192)
The root mean square (RMS) value of the current is calculated as follows:
Ieff = √((I₁² + I₂² + . .. + I₈₁₉₂²) / 8192)
The power factor λ (cos φ) is calculated as follows:
λ = ∫ U × I dt / Sλ = ∫ U × I dt / (Ueff × Ieff)
The active power P is calculated as follows:
P = PF × F
8.3. Operating Concept
The following section explains the controls of the Hyperion energy meter.
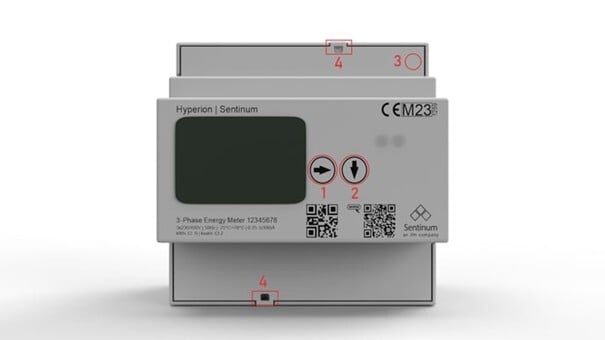
Buttons
The meter is operated using two touch buttons and a service button (SRVC).
Right Arrow (Button 1)
- Short press (< 2 s): Go to the next main menu page.
- Long press (> 2 s): Go to the previous main menu page (starting with firmware 1.3.0).
Down Arrow (Button 2)
- Short press (< 2 s) : Switch between the submenu pages of the current main menu.
- Long press (> 2 s): Execute the respective special function in the submenu.
Service button (SRVC)
- The Service button is recessed into the housing and must only be pressed with a thin, non-conductive tool.
- Short press (< 2 s): Activates edit mode in the "Settings" menu.
- Second short press (& lt; 2 s): Exits edit mode without saving.
- Long press (> 2 s): Saves changes made in the "Settings" menu.
- After installation, the service button can be protected against unauthorized changes by applying a seal.
The cover for the current and voltage connections can also be sealed.
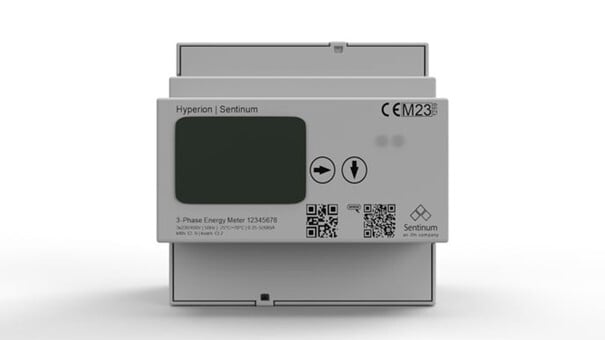
8.4. Overview: Front View of the Hyperion
The front of the Hyperion energy meter features the following key controls and displays.
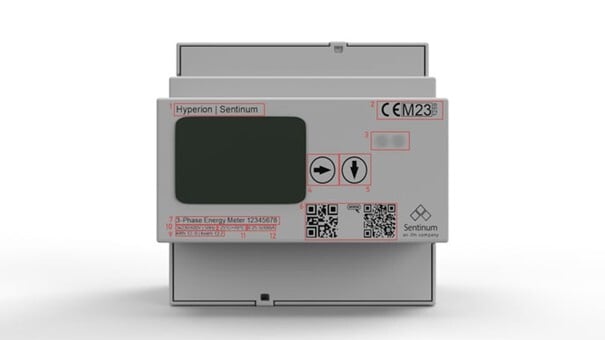
The front panel also features the following labeled elements:
- Model designation
- Active energy certification
- D0 -Interface
- "Right Arrow" control button
- "Down Arrow" control button
- QR code with serial number and website address
- Number of phases and conductors
- Serial number
- Class designation
- Reference voltage and reference frequency
- Operating temperature
- Current range
- Company logo
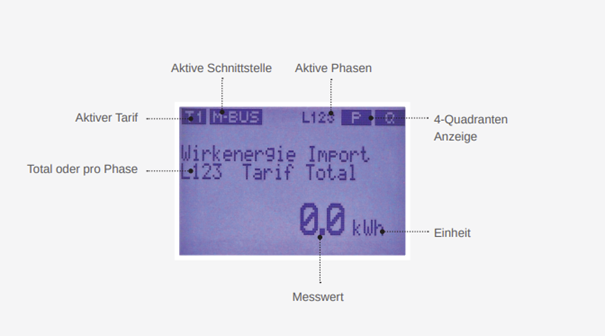
8.5. Overview of the Hyperion Display
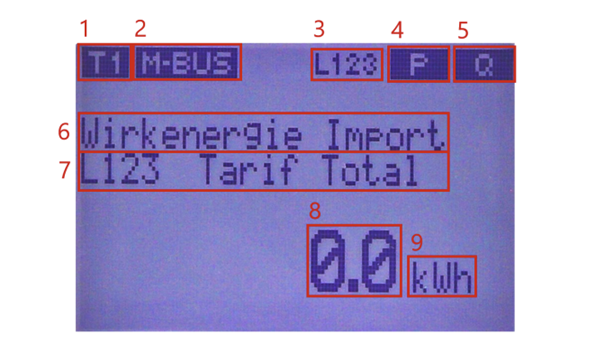
- Current Rate
- Active Communication Interface (model-dependent)
- Phase Sequence
- Four-Quadrant Display for Active Energy:
<<P: Active energy is being fed into the grid.P& >>: Active energy is being drawn.
- Four-quadrant display for reactive power:
<<Q: Reactive power is being fed into the grid (inductive).Q>>: Reactive power is being drawn (capacitive).
- Measured value / Menu item
- Submenu item
- Current measured value
- Unit of the current measured value
The following table contains all symbols that can be displayed on the screen.
| Symbol | Description |
|---|---|
| T1 | Displays the currently active rate tier. The number corresponds to the selected rate. |
| MODBUS | The meter's communication interface is Modbus. |
| ETH | The meter's communication interface is TCP/IP. |
| M-BUS | The meter's communication interface is M-Bus. |
| LORA | The meter's communication interface is LoRaWAN®. |
| L123 | All three phases are connected. If individual numbers are replaced by "-", the corresponding phases are not connected. |
| ▶▶ | The meter is currently measuring active energy consumption. |
| ◀◀ | The meter is currently measuring active energy supply. |
| Q+ | The meter is currently measuring of reactive energy (capacitive). |
| Q− | The meter is currently measuring the supply of reactive energy (inductive). |
| OF | One or more energy registers have detected an overflow. |
| MEM | The meter's internal memory is faulty. Create a ticket at https://www. emuag.ch/support/formulare/. |
The following symbols appear exclusively on the LP version of the Hyperion energy meter.
| Symbol | Description |
|---|---|
| TNV | The time on the meter is invalid. Synchronize the device's date and time. |
| TNS | The time on the meter is not correctly synchronized. |
| NTP | Applies only to devices with a TCP/IP interface. The meter has not received time synchronization for at least one hour. |
| PTB NV | The meter is in a state that is invalid under calibration law . Further measurements must no longer be used for billing purposes. |
| MEM | The meter's internal memory is defective. |
8.6. Compatible Devices
Supported Interfaces:
- M-Bus
- TCP/IP, Modbus TCP
- Modbus RTU
- LoRaWAN®
9. Installation
The Hyperion can be installed in any orientation. The meter is designed for mounting on a DIN rail in accordance with EN 50022. Alternatively, the meter can be installed using a front-mounting frame. To remove the meter from a DIN rail, pull on the spring-loaded latch on the front of the device. The wiring for transformer-based meters should be kept as short as possible.
If significant measurement deviations occur after commissioning, please observe the following instructions:
- The use of Rogowski coils is not recommended for transformer-based meters due to the multiple current and voltage conversions with external amplification. Each conversion and amplification stage increases the potential measurement error.
Self-consumption
Every energy meter has a self-consumption. A main meter therefore typically measures more energy than the sum of the downstream submeters. Depending on the model, a Hyperion requires up to 2 W per phase. This results in a typical self-consumption of approximately 36 kWh per year or a maximum of 52.5 kWh per year.
Inrush current
- The Hyperion 3/5 begins counting at a phase current of 1 mA or higher.
- The Hyperion 3/ 100 begins counting at a phase current of 20 mA.
- For transformer-based meters, the current transformers used must be appropriately sized.
Accuracy
- In accordance with EN 50470, the Hyperion complies with accuracy class B for active energy and class 2 for reactive energy.
- As a result, measurement deviations of up to 1% for active energy and up to 2% for reactive energy may occur.
- The total energy of a main meter is affected by this error only once, whereas measurement deviations can add up across multiple submeters.
- Example: A main meter supplies 20 submeters. Each submeter measures 0.2% less energy, while the main meter measures 0.2% too much. With an actual energy consumption of 100 kWh, this results in an energy difference of 4.2 kWh, or 4.2%.
Energy Direction (Transformer Meters)
- If only positive currents are expected, but one or more currents with a negative sign are displayed, the respective current transformer is connected in the reverse direction.
Transformer Factor (Transformer Meter)
- The meter's transformer factors must be set according to the installed current and voltage transformers.
Correct Phase Assignment
- Current L1 and voltage L1 must be assigned to the same measuring system. Please refer to the respective wiring diagram for transformer-based meters.
A Hyperion meter weighs approximately 350 g.
9.1. Safety Instructions
Electric meters may only be installed by qualified electricians. Current transformers must not be operated with their covers open, as this can result in dangerous voltages. This can lead to personal injury and property damage.
During installation, installing, and replacing the meter, all connected conductors must be de-energized. Touching live parts is life-threatening.
The Hyperion 3/5 transformer meter carries voltage along the current path. Ensure that the voltage paths are also de-energized before connecting current transformers. Touching live parts is life-threatening.
According to DIN VDE 0100-557, Section 5.3.1, the secondary terminals of current transformers in low-voltage switchgear must not be grounded.
Only the intended screw and spring terminals may be used to connect the meter. The use of wire end ferrules is recommended.
Failure to follow the installation instructions may result in damage to or destruction of the device. Therefore, it is essential that you strictly adhere to the installation specifications described.
9.2. Commissioning / Inspection
The following points must be checked during commissioning:
- Rotation direction
- Current per phase and energy direction
- Phase sequence L1 → L2 → L3
- Current transformer ratio
- Voltage transformer ratio
- Correct tightening torque for all terminals
- When using a data acquisition interface: correct addressing
The Hyperion energy meter may only be used to measure electrical energy and must only be operated within the specified technical specifications.
9.3. Factory Default Settings
S0 output: Active energy consumption (Pins 6 + 7)
Transformer-based meter: 10 pulses / kWh
Direct-connection meter: 1000 pulses / kWh
Dimensions: For dimensions, please consult the document "Dimensional Drawing Hyperion" (Doc. Ref. 1420).
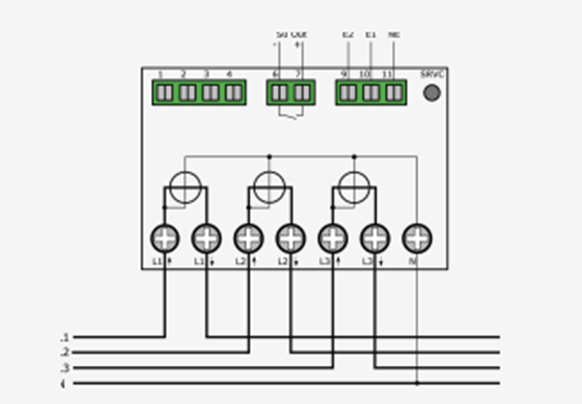
9.4. Connection Diagram for Direct Connection (3-Phase Operation)
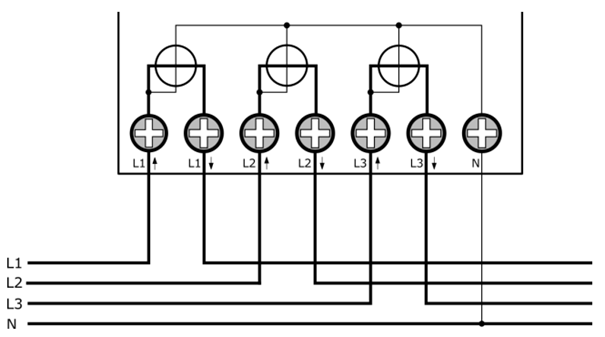
With a direct-connection meter, the voltage is tapped internally. The neutral conductor is connected to terminal N.
When connecting the power lines, observe the arrow markings on the meter's connection terminals. Lx ↑ indicates the utility-side connection, Lx ↓ indicates the consumer- or generator-side connection.
This also applies if the Hyperion is to measure only supplied energy. The Hyperion measures both purchased and supplied energy correctly.
The following table contains the most important specifications for the connections.
| Rated | I min | Itr | Iref | Imax |
|---|---|---|---|---|
| 0.02 A | 0.15 A | 0.5 A | 5 A | 100 A |
Make sure that all connected wires are de-energized before inspecting or modifying them. Touching live components can result in serious injury or death!
9.5. Wiring Diagram Direct Connection (Single-Phase Operation)
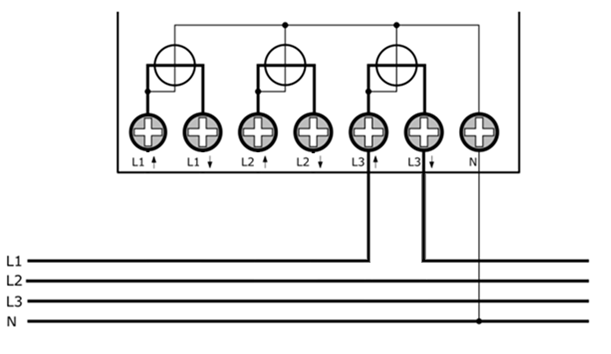
The energy meter is suitable for both single-phase and three-phase operation. However, MID compliance applies exclusively to three-phase operation. In single-phase operation, the meter is not MID-compliant.
For single-phase operation, the connection diagram shown must be strictly followed. The corresponding terminals must be wired correctly according to the illustration, particularly the assignment of phase (L) and neutral (N). Deviations from the specified wiring diagram can lead to measurement errors or malfunctions.
For single-phase operation, phase L1 is routed through the L3 terminals. Specifically, this means:
- The input (L1) is connected to the L3 input terminal (↑).
- The output to the load is routed from the L3 output terminal (↓).
- The neutral conductor (N) is connected directly as intended.
In this case, the L1 and L2 terminals remain unused.
9. 6. Wiring Diagram for Transformer Meter
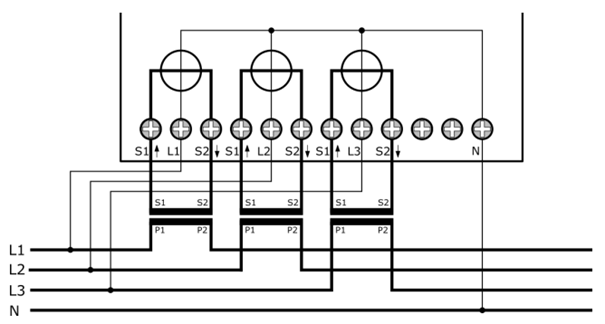
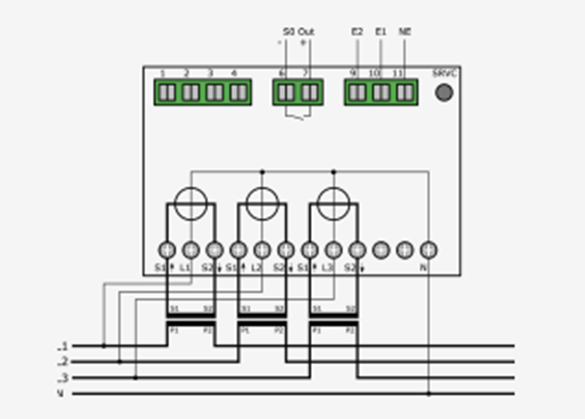
With a transformer meter, the voltage is tapped externally. Connect the respective phases to terminals L1, L2, and L3. The neutral conductor is connected to the terminal N.
When connecting the current transformers, observe the arrow directions on the meter's connection terminals.
S1 ↑indicates the utility-side connection.S2 ↓indicates the consumer- or generator-side connection.
This also applies if the Hyperion is intended to measure only energy supplied. The Hyperion accurately measures both energy consumption and energy supplied.
Due to the voltage present in the current path of the Hyperion Energy Meter 3/5, the connected current transformer must not be grounded.
The two terminals between S2 ↓ the third phase and the neutral conductor are intended for functions that are currently still under development. Nothing may be connected to these terminals. Incorrect connections can result in damage to or destruction of the meter.
The following table contains the most important specifications for the two transformer connections:
| Specification | Current Transformer /5 A | Current Transformer /1 A |
|---|---|---|
| Actual | 0.005 A | 0.001 A |
| Imin | 0.05 A | 0.01 A |
| Itr | 0.25 A | 0.05 A |
| Iref | 5 A | 1 A |
| Imax | 6 A | 1.2 A |
Make sure that all connected wires are de-energized before inspecting or modifying them. Touching live components can cause serious injury or even death.
9.7. Tightening Torque
| Measuring Circuit / Mains | Direct Connection up to 35 mm² (stranded wire) | Transformer Connection up to 6 mm² (stranded wire) |
|---|---|---|
| Supply line L1 / L2 / L3 | 2 – 3 Nm | 0.8 – 1 Nm |
| Supply line N | 2 – 3 Nm | 0.8 – 1 Nm |
It is recommended to use wire end ferrules.
All rear pins are equipped with spring-loaded terminals.
9.8. Spring-Loaded Terminals Strand Cross-Section
| Terminal | Conductor Cross-Section | Strip Length |
|---|---|---|
| S0 Pulse Output | 1.5 mm² stranded wire | 12 mm |
| Rate control | 1.5 mm² stranded wire | 12 mm |
| M-Bus / Modbus | 1.5 mm² stranded wire | 12 mm |
When connecting cables carrying currents above 65 A, ensure that the conductor cross-section is sufficiently sized.
10. Operation
The following describes how to navigate through the various menus and submenus.
10.1. Main Menu Pages
After the power supply is initially connected , the test screen appears first. After about two seconds, the "Active Energy Import" main menu page is displayed.
Each time you press the Right Arrow button, you navigate through the various main menu pages.
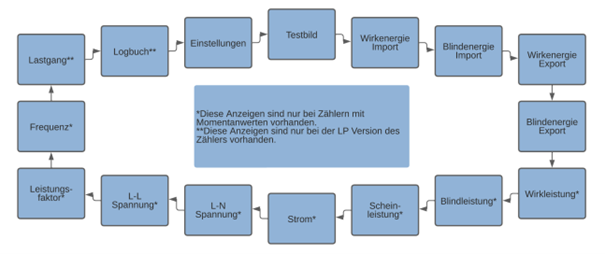
By pressing and holding the "Right Arrow" button for more than 2 seconds, you can also scroll backward through the circular menu (firmware version 1.3.0 or later).
Depending on the meter configuration, one or more main menu pages may not be available. Please refer to the overview shown above.
10.2. Submenu Pages
The available submenu pages are described below.
Energy Displays
The main menu pages for Active Energy Import/Export and Reactive Energy Import/Export display the total energy consumption or total energy supplied, respectively. By default, the following schema is used for the submenu pages:
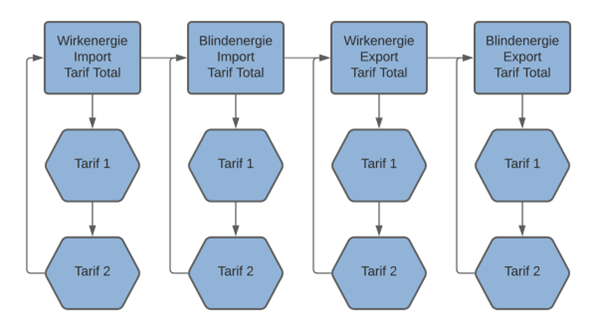
Different displays can be configured. For more information, see the chapter "Display Settings."
To ensure the most accurate display of energy values possible, the Hyperion features an autorange function. If the displayable range is exceeded, the message OF appears on the display. The registers that can be read via the communication interfaces only overflow at significantly higher values (approx. 18 billion GWh) than the display (99 million MWh).
The energy values are shown on the display according to the following scaling:
| Meter reading (Wh) | Divider (prescaler) | Divider (decimal place) | Display range start | Display range end | Unit | Change |
|---|---|---|---|---|---|---|
| 1 | 100 | 10 | 0.0 | 0.0 | kWh | - |
| 10 | 100 | 10 | 0.0 | 0.0 | kWh | - |
| 100 | 100 | 10 | 0.1 | 0.9 | kWh | - |
| 1,000 | 100 | 10 | 1.0 | 9.9 | kWh | - |
| 10. 000 | 100 | 10 | 10.0 | 99.9 | kWh | - |
| 100,000 | 100 | 10 | 100.0 | 999.9 | kWh | - |
| 1 × 10 ⁶ | 100 | 10 | 1000.0 | 9999.9 | kWh | - |
| 10 × 10⁶ | 100 | 10 | 10,000.0 | 99,999.9 | kWh | - |
| 100 × 10⁶ | 100 | 10 | 100,000. 0 | 999999.9 | kWh | - |
| 1 × 10⁹ | 100 | 10 | 1000000.0 | 99999 99.9 | kWh | - |
| 10 × 10⁹ | 1,000 | 1,000 | 10,000. 000 | 99999.999 | MWh | 3 decimal places; unit MWh |
| 100 × 10⁹ | 10,000 | 100 | 1,000 00.00 | 999999.99 | MWh | 2 decimal places |
| 1 × 10¹² | 100,000 | 10 | 1,000,000.0 | 9,999,999.9 | MWh | 1 decimal place |
| Meter reading (Wh) range | Divisor (prescaler) | Divisor (decimal place) | Display range start | Display range end | Unit | Change |
|---|---|---|---|---|---|---|
| 10 × 10¹² | 1,000,000 | 1 | 10000000 | 99999999 | MWh | No decimal places |
| 100 × 10¹² | - | - | Display Overflow | Display Overflow | MWh | Display Overflow, Restart from 0 |
| 1 × 10¹⁵ | - | - | Display Overflow | Display Overflow | MWh | - |
| 10 × 10¹⁵ | - | - | Display Overflow | Display Overflow | MWh | - |
| 100 × 10¹⁵ | - | - | Display Overflow | Display Overflow | MWh | - |
| 1 × 10¹⁸ | - | - | Display Overflow | Display Overflow | MWh | - |
| 10 × 10¹⁸ | - | - | Display Overflow | Display Overflow | MWh | Overflow Counter |
Maximum energy register value: 18,446, 744,073,709,600,000 Wh = 18,446.7 PWh
10.3. Power and Electricity Consumption
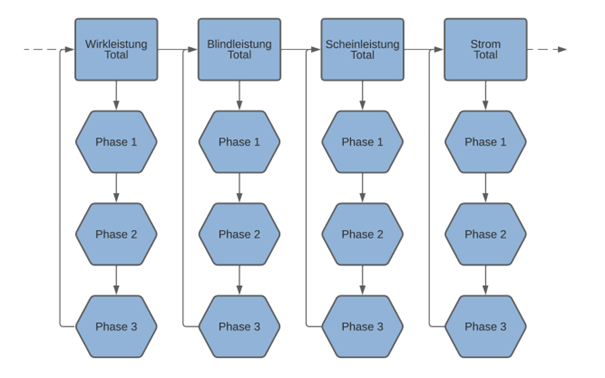
The main menu pages "Active Power," "Reactive Power," and "Apparent Power " each display the current total power across all three phases.
Use the Down Arrow key to switch between the power values of the individual phases.
On the Current main menu page, the total current of all three phases is displayed by default. Use the Down Arrow key to view the current values for the individual phases.
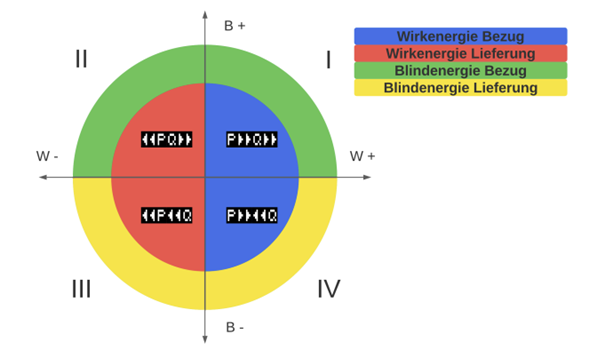
The four-quadrant diagram shows the relationship between positive and negative active and reactive power. When active power is negative, the displayed current is also shown as negative. In addition , the energy directions (P>>, Q>> etc.) are displayed.
Quadrant I
- Positive active power; active energy reference register is incremented.
- Reactive power is positive; the reactive energy consumption register is incremented.
Quadrant II
- Active power is negative; the active energy delivery register is incremented.
- Reactive power is positive; the reactive energy delivery register is incremented.
Quadrant III
- Active power is negative; the active energy consumption register is incremented.
- Reactive power is negative; the reactive energy consumption register is incremented.
Quadrant IV
- Active power is positive; active energy consumption register is increased.
- Reactive power is negative, reactive energy consumption register is increased.
10.4. Voltage, Power Factor, and Frequency
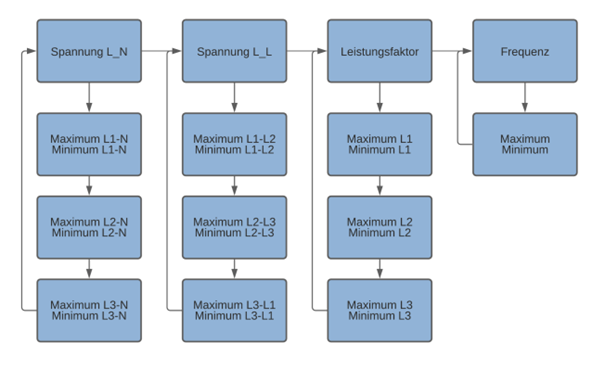
These menu pages display the current values for voltage, power factor, and frequency. The display is updated every second.
If the Min/Max Values function is enabled, pressing the Down Arrow key briefly (& < 1 s) the Down Arrow button to display the maximum and minimum measured values.
In addition, the timestamp of the respective minimum or maximum value is displayed.
Load Profile and Log Book
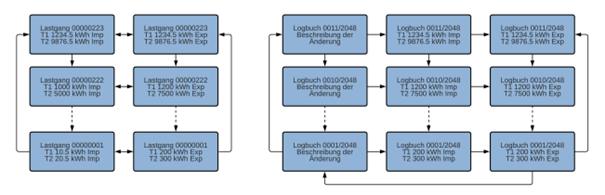
By briefly pressing (< 1 s) the Down Arrow button, you can navigate through the saved load profiles and log book entries. The display starts with the most recent entry each time.
Pressing and holding (> 2 s) the Down Arrow button allows you to switch between "Consumption" and "Supply" in load profiles.
In the logbook, you can switch between the actual changes and the corresponding meter readings at the time of the change.
11. Configuration Settings
11.1. Basic Settings
Language | Sprache
Switch between the languages German (default setting) and English.
- Use the "Right Arrow" to navigate to the "E settings."
- Use the "Down Arrow" to select the "Language" menu item.
- Press the Service button briefly (< 2 seconds).
- Use the "Down Arrow" to select between German and English.
- To save, press and hold the service button for more than 2 seconds until the display flashes.
Rate Switching
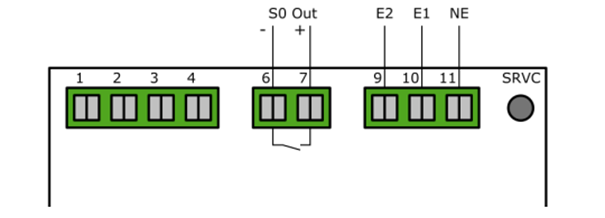
Any change to the rate is applied immediately. The rate present at terminals 9 through 11 at that moment becomes active immediately.
The rate signal consists of an AC voltage of 230 VAC applied between NE (terminal 11) and E2 (terminal 9) or E1 (terminal 10).
The rate switching occurs according to the following truth table. The following applies:
- 0 = 0 VAC relative to NE (Terminal 11)
- 1 = 230 VAC relative to NE (Terminal 11)
| E2 (Terminal 9) | E1 (Terminal 10) | Tariff |
|---|---|---|
| 0 | 0 | 1 |
| 0 | 1 | 2 |
| 1 | 0 | 3 |
| 1 | 1 | 4 |
Tariff 1 is preset at the factory. The tariff inputs are electrically isolated internally via optocouplers.
For the LP version of the Hyperion energy meter, a tariff change is not applied until the start of a new recording period. The tariff present at terminals 9 through 11 at that time remains active at least until the start of the next recording period.
Set the number of rate plans
In the settings, you can specify the number of rate plans to be used. You can choose between Dual-rate plan (2) and Quadruple-rate plan (4) can be selected.
- Press the "Right Arrow" until you reach the Settings menu.
- Press the "Down Arrow" until you reach the Number of Tariffs menu item.
- Briefly press the "Service Button" (< 2 seconds).
- Use the "Down Arrow" to switch between 2 rate plans and 4 rate plans.
- Save: Press the "Service Button" for more than 2 seconds until the LCD display flashes.
All illustrations in this documentation show dual-rate operation. Operation and menu navigation are identical for four-rate operation.
The LP version of the Hyperion energy meter operates exclusively in two-rate mode. This setting cannot be changed.
Real-time clock
The real-time clock of the Hyperion energy meter can be configured directly on the device or via optional interfaces.
The available interfaces (TCP/IP, M-Bus, Modbus, and LoRaWAN®) also enable synchronization with a time server, allowing the meter to update automatically.
The Hyperion's internal clock has a typical deviation of approximately ±0.4 seconds per day.
The LP version includes additional status messages for monitoring the real-time clock. For more information, see the PTB-A-50. 7-specific chapter of this manual.
Configuration on the Device
The real-time clock can be set directly on the Hyperion energy meter. The internal clock is backed up by an energy storage device for at least 18 days in the event of a power failure.
The meter must have been in operation for at least two hours so that the internal energy storage can be fully charged.
- Press the "Right Arrow" until you reach the Settings menu.
- Press the "Down Arrow" " until you reach the menu item Real-Time Clock.
- Briefly press the "Service Button" (< 2 seconds).
- Use the "Right Arrow" to select the desired digit.
- Use the "Down Arrow" to increase the selected digit.
- Save: Press the "Service button" for more than 2 seconds until the LCD display flashes.
Automatic Time Synchronization
Time synchronization takes place via M-Bus using a defined command through the meter's respective interface. During this process, date and time information is transferred to the meter.
Synchronization takes effect immediately and is confirmed by the meter with an ACK message.
Devices with a TCP/IP or LoRaWAN® interface can automatically synchronize with a configured time server.
Until the first successful synchronization, a request is sent to the time server every 12 minutes. After that, synchronization occurs automatically once per hour.
For projects requiring load profile certification in accordance with PTB-A 50.7, only 2,048 entries are available for time changes, converter factor changes, S0 pulse value changes, or changes to the pulse length. Once this limit is exceeded, the counter enters a state that is invalid under metrology regulations. Furthermore, time synchronizations may only occur once per load profile interval.
Load Profile Interval
The load profile interval can be set . Available intervals are:
1 minute, 5 minutes, 15 minutes (default), 30 minutes, 1 hour, 6 hours, 12 hours, or 24 hours.
- Press the "Right Arrow" until you reach the Settings menu.
- Press the "Down Arrow" until you reach the menu item Load Profile Interval.
- Press the "Service Button" briefly (< 2 seconds).
- Use the "Down Arrow" to select the desired interval.
- Save: Press and hold the "Service Button" for more than 2 seconds, until the LCD display flashes.
This setting is only available on devices with load profile enabled. TCP/IP and LoRaWAN® variants are shipped with load profile enabled .
The LP version of the Hyperion energy meter has a fixed load profile interval of 15 minutes. This setting cannot be changed.
11.2. Setting the Transformation Ratios
The transformation ratio can be configured directly using the control buttons on the Hyperion energy meter.
- Press the "Right Arrow" until you reach the Settings menu.
- Press the "Down Arrow" until the menu item CT / VT Ratio.
- Briefly press the "Service" button (< 2 seconds).
- Use the "Right Arrow" to select the desired digit.
- Use the "Down Arrow" to increase the selected digit.
- Save: Press the "Service button" for longer than 2 seconds until the LCD display flashes.
The current transformer ratio (CT Ratio) can be set as follows:
- 5/5 A to 20,000/5 A in 5 -A increments
- 1/1 A to 4,000/1 A in 1-A increments
The voltage transformer ratio (VT Ratio) can be set from 100 V / 100 V to 36,000 V / 100 V in 100-V increments.
Both the primary and secondary currents of the current transformer being used must be entered correctly.
A set ratio of 100 : 1 means, for example, means, for example, that with a primary current of 100 A, a secondary current of 1 A flows.
Make sure that the set transformer ratio corresponds to the actual current or voltage transformer in use. Incorrect settings or incorrectly sized transformers will result in erroneous energy and power values.
For projects requiring load profile certification according to PTB-A 50.7, only 2,048 entries are available for transformer ratio changes, time changes, S0 pulse value changes, or changes to the pulse length. After that, the meter is in a state that is invalid under calibration law. Changes to the transformer ratio may only be made once per load profile interval.
11.3. Additional Settings Options
S0 Pulse Value
The pulse value of the S0 output can be set in the settings.
- Use the "Right Arrow" to switch to the Settings menu.
- Use the "Down Arrow" to navigate to the S0 Pulse Type menu item.
- Briefly press the Service button (< 2 seconds).
- Use the "Down Arrow" to select between 1, 10, 100, 1000, and 10,000 pulses/kWh.
- To save, press and hold the Service button for more than 2 seconds until the display flashes.
For projects requiring load profile certification in accordance with PTB-A 50.7, only 2,048 entries are available for changes to pulse values, time settings, conversion factors, or the S0 pulse length. Furthermore, the S0 pulse value can only be changed once per load profile interval .
Energy Display Settings
Specify which energy values should be shown on the display. The following options are available:
Energy per Rate
- On: On the "Active Energy Import," "Active Energy Export," "Reactive Energy Import," and "Reactive Energy Export" main menu pages, the Hyperion displays the energy consumed or supplied separately for each rate.
- Off: Only the total energy across all rates is displayed. The display is then also determined by the setting "Energy per Phase."
Energy per Phase
- On: On the aforementioned main menu pages, the Hyperion displays the energy consumed or supplied per phase.
- Off: Only the total energy is displayed. The display is also determined additionally on the "Energy per Tariff" setting.
Depending on the selected configuration of the energy display, different submenu structures result for energy import and energy export.
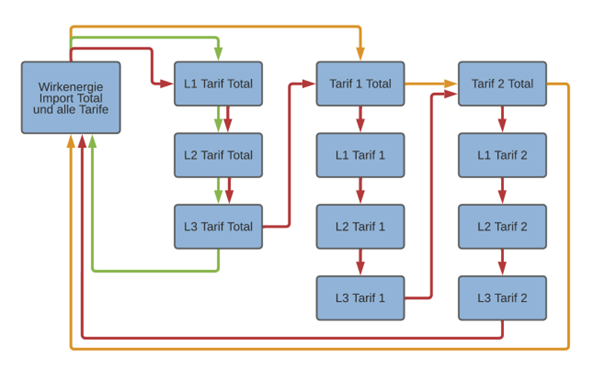
The following legend applies:
- Green: Only the "Energy per Phase" option is enabled.
- Orange: Only the "Energy per Tariff" is enabled.
- Red: Both options are enabled.
Interface Configuration
The Hyperion can be equipped with various interfaces; however, only one interface is available per device.
Interfaces
The Hyperion optionally features one of the following wireless interfaces:
- LoRaWAN®
- mioty®
Each Hyperion energy meter has only one of these interfaces. Configuration is performed directly on the device using the touch-sensitive control buttons.
M-Bus
The M-Bus interface complies with the EN 13757-2/-3 standard (formerly EN 1434 -3). This allows the Hyperion M-Bus to communicate with all M-Bus-compatible devices.
The M-Bus interface is integrated into the energy meter and protected against contamination and tampering.
The connections are located on the back of the device:
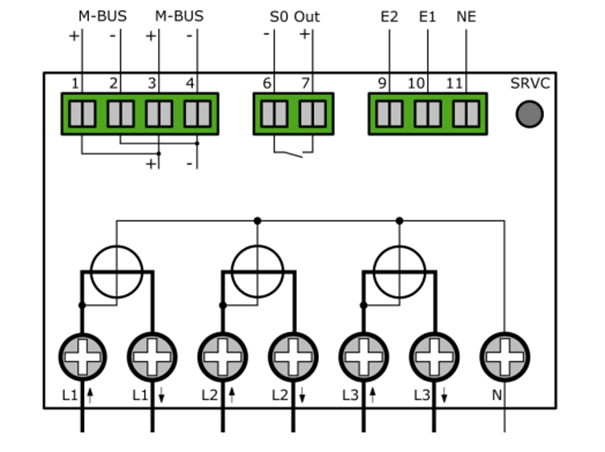
- Pin 1 [3] = M-Bus (+)
- Pin 2 [4] = M-Bus (-)
Factory settings
| Setting | Value |
|---|---|
| Secondary address Primary address Baud rate |
Device serial number 0 2400 |
12. M-Bus Wiring Diagram
The Hyperion energy meter with an M-Bus interface has two M-Bus terminals connected in parallel internally terminals connected in parallel internally. This simplifies the serial wiring of multiple devices during installation.
The M-Bus interface is identical on the Hyperion 3/100 M-Bus and Hyperion 3/5 M-Bus models.
13. Additional Configurations, Communication, and Error Handling
13.1. Configurations
Configuring the Primary Address on the Device
- Use the "Right Arrow" to navigate to the Settings menu.
- Use the "Down Arrow" to navigate to the menu item M-Bus Primary Address.
- Briefly press the Service button (< 2 seconds).
- Use the "Right Arrow" to select the desired digit.
- Use the "Down Arrow" to increase the selected digit.
- To save, press and hold the Service button for more than 2 seconds until the display flashes.
Configuring the Secondary Address on the Device
- Use the "Right Arrow" key to navigate to the Settings menu.
- Use the "Down Arrow" key to navigate to the M -Bus Secondary Address.
- Press the Service button briefly (< 2 seconds).
- Use the "Right Arrow" to select the desired digit.
- Use the "Down Arrow" to increase the selected digit.
- To save, press and hold the service button for more than 2 seconds until the display flashes.
Configuring the baud rate on the device
- Use the "Right Arrow" key to navigate to the Settings menu.
- Use the "Down Arrow" key " to navigate to the menu item M-Bus Baud Rate.
- Briefly press the Service button (< 2 seconds).
- Use the "Right Arrow" key to cycle through the baud rates 300, 600, 1,200, 2,400 (default), 4,800, and 9,600 baud.
- To save, press and hold the Service button for more than 2 seconds until the display flashes.
Configuration via MB-Connect
The Hyperion M-Bus can also be configured and set up using the in-house software MB-Connect.
S0 Pulse Output
The S0 pulse output meets the requirements of the EN 62053-31 (DIN 43864). Every Hyperion has an S0 pulse output and can therefore communicate with devices that can receive and evaluate S0 pulses.
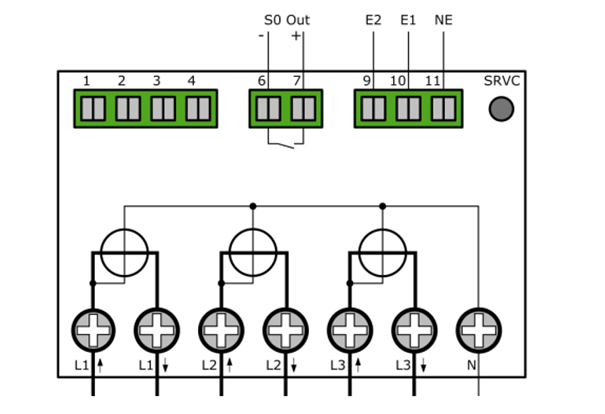
The interface is located on the back of the meter at pins 6 and 7. A heavy-duty Opto-Power-MOSFET rated for 5 to 60 V AC or DC is used as the switching element. The S0 output is potential-free.
When connecting the S0 output, ensure correct polarity.
Factory Settings
| Connection | Description |
|---|---|
| Transformer meter | 10 pulses per kWh / kvarh at 120 ms pulse length |
| Direct-connection meter | 1000 pulses per kWh / kvarh at 40 ms pulse length |
S0 pulse output connection diagram
The S0 interface is identical for the Hyperion 3/100 and the Hyperion 3/5.
Configuration: Readout Type
- Press the "Right Arrow" until you reach the Settings menu.
- Press the "Down Arrow" until you reach the S0 Pulse Readout Type.
- Briefly press the "Service button" (< 2 seconds) .
- Use the "Right Arrow" to switch between the following output modes:
- Active Energy Diff: All active energy (purchased and supplied) is output together.
- Reactive Energy Diff: All reactive energy (purchased and supplied) are displayed together.
- Active Energy Import: Only purchased active energy is displayed.
- Reactive Energy Import: Only purchased reactive energy is displayed.
- Active Energy Export: Only supplied active energy is displayed.
- Reactive Energy Export: Only supplied reactive energy is displayed.
- Save: Press the "Service Button" for more than 2 seconds until the LCD display flashes.
S0 Pulse Rate Configuration
The pulse value can be set in the settings.
- Press the "Right Arrow" until you reach the Settings menu.
- Press the "Down Arrow" until you reach the menu item S0 Pulse Value.
- Briefly press the "Service Button" (< 2 seconds).
- Use the "Down Arrow" to select between 1, 10, 100, 1000, and 10,000 pulses/ kWh.
- To save: Press the "Service button" for more than 2 seconds until the LCD display flashes.
S0 Pulse Width Configuration
The pulse width can be defined in the settings.
- Press the "Right Arrow" until you reach the E Settings.
- Press the "Down Arrow" until you reach the menu item S0 Pulse Width.
- Briefly press the "Service Button" (< 2 seconds).
- Use the "Down Arrow" to select between 2 ms, 10 ms, 30 ms, 40 ms, and 120 ms.
- To save: Press the "Service button" for longer than 2 seconds until the LCD display flashes.
Modbus Wiring Diagram
The Modbus interface is identical for the Hyperion 3/100 Modbus and the Hyperion 3/5 Modbus.
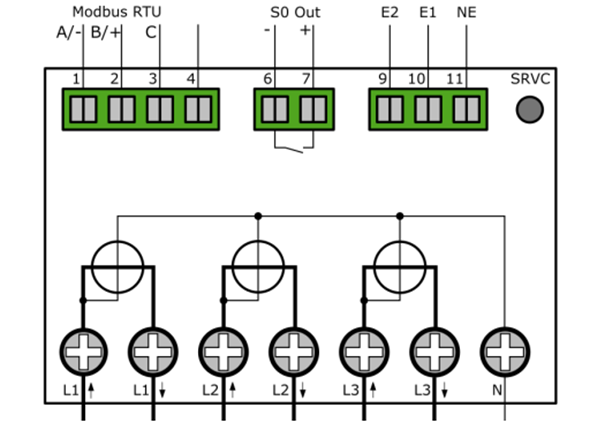
13.2. LoRaWAN® Factory Settings
The Hyperion supports communication via LoRaWAN®.
Factory Settings
By default, the Hyperion transmits the following data every 15 minutes:
- Timestamp
- Active energy import, tariffs 1 and 2
- Active energy export, tariffs 1 and 2
- Error code
13.3. mioty® Factory Settings
The Hyperion supports communication via mioty®.
Factory Settings
Profile 0 is used by default.
Profile 0: Complete Data
Comprehensive transmission of power, current, voltage, energy, and power quality values.
- Power (W): p_l1_a, p_l2_a, p_l3_a, p_l123_a
- Current (mA): i_l1, i_l2, i_l3, i_l123
- Voltage (V ÷ 10): u_l1, u_l2, u_l3, u_l12, u_l23, u_l31
- Energy (Wh): e_ta_a_i, e_ta_a_e, e_ta_r_i, e_ta_r_e
- Power Quality: pf_l1–3 (÷100), f (Hz ÷10)
- Status: pwr_fail
For more information on the available profiles, see the document HYPERION MIOTY PROFILE DE.
Nomenclature
- Voltage: u_lX (Phase / Line)
- Current: i_lX (Phase / Total Current)
- Power: p_lX_a (Active Power per Phase / Total)
- Energy: e_t{a|1|2}_{a|r}_{i|e} (e.g., e_ta_a_i)
- Power Factor: pf_lX
- Frequency: f
- Transformer Ratio: {ct|vt}_{act|old}_{prim|sec}
13. 4. Error Cases
If you detect an error with the Hyperion, first consult the following information on the most common error patterns.
Discrepancies in Energy Measurement by the Hyperion Energy Meter
Initial Situation: One or more phase currents are displayed with a negative sign .
Solution: Check whether the connections S1 ↑ and S2 ↓ (for direct-connection meters: Lx ↑ and Lx ↓) are connected correctly.
S1 ↑ or Lx ↑ must always be connected to the utility side . S2 ↓ or Lx ↓ must always be connected to the load or generation side.
Before inspecting or modifying connection wires, all connected conductors must be . Touching live parts is life-threatening.
The meter is measuring too much or too little energy
Solution 1: Check the set current transformer and voltage transformer ratios. The settings must correspond to the transformers actually in use.
Solution 2: Check that the meter is wired correctly. Phases with negative current flow are assigned to the export register.
If the Hyperion is used as a totalizing meter, the total energy may differ from the sum of several downstream energy meters. The total includes the respective individual measurement errors of all devices involved.
Incorrect consumption display for transformer-based meters
Initial : The Hyperion displays a significantly higher or lower consumption than expected.
Solution: Ensure that the set current transformer ratio matches the current transformer actually in use.
The current transformer ratio can be configured directly using the Hyperion's control buttons.
- 5 / 5 A to 20,000 / 5 A in 5-A increments
- 1 / 1 A to 4,000 / 1 A in 1-A increments
Incorrect consumption display in single-phase operating mode
Initial situation: The Hyperion is counting incorrectly or the energy meter reading is not increasing during single-phase operation.
Solution: Check the wiring diagram for single-phase operation as described in Chapter 9.5.
Behavior for Consumption and Delivery
The Hyperion stores energy consumption and energy delivery in separate registers.
The register values are never counted backward or offset against each other.
The register Active Energy Consumption contains the electrical energy consumed from the utility and forms the basis for energy consumption.
The register Active Energy Supplied contains the energy fed into the grid, for example from a photovoltaic system.
Example:
Current consumption of a residential complex at 1:00 p.m.:
- Phase L1: 10 kW
- Phase L2: 20 kW
- Phase L3: 30 kW
Total consumption: 60 kW
Feed-in from the photovoltaic system at 1:00 p.m.
- Phase L1: 25 kW
- Phase L2: 25 kW
- Phase L3: 25 kW
Total feed-in: 75 kW
In this case, 15 kW is currently being fed into the grid.
The Active Energy Consumption register remains unchanged for phases L1 and L2, since no energy is being drawn from the grid.
The Active Energy Supply register is increased for phases L1 and L2, since energy is being fed back into the grid there.
Phase L3 . Therefore, the Active Energy Supplied register for L3 remains unchanged, while the Active Energy Consumed register is further increased.
The Hyperion is supplying incorrect values via the pulse output
Check whether the configured pulse rate and pulse duration of the Hyperion energy meter match the specifications of your pulse receiver.
The pulse rate and pulse duration can be adjusted directly using the Hyperion's control buttons.
Available settings:
- Pulse rates: 1, 10, 100, 1000, or 10,000 pulses per kWh / kvarh
- Pulse widths: 2 ms, 10 ms, 30 ms, 40 ms, or 120 ms
The following values are set at the factory:
| Connection | Description |
|---|---|
| Transformer meter | 10 pulses per kWh / kvarh at a pulse width of 120 ms |
| Direct-connection meter | 1,000 pulses per kWh / kvarh with a pulse length of 40 ms |
The tariff switching is not working
Tariff 1 is enabled by default. Check whether the tariff switching has been connected correctly.
| E2 (Terminal 9) | E1 (Terminal 10) | Tariff |
|---|---|---|
| 0 | 0 | 1 |
| 0 | 1 | 2 |
| 1 | 0 | 3 |
| 1 | 1 | 4 |
For load profiles according to PTB-A 50.7, only two-rate operation is available. Tariff changes are not applied until the start of the next recording interval.
When making changes to the tariff connections, all connected conductors must be de-energized. Touching live parts is life-threatening.
The LoRaWAN® communication interface is not working
- Make sure that the meter is registered on your LoRaWAN® network server.
- Check whether the set LoRaWAN® transmission interval matches the available network bandwidth. A high number of end devices on the same network can impair communication.
- Ensure that the meter can synchronize its time via the LoRaWAN® network.
14. Advanced Information on Load Profiles According to PTB-A 50.7
14.1. Measurement Accuracy Guidelines: Requirements for Users Pursuant to Section 23 of the and Calibration Ordinance
The Measurement and Calibration Ordinance requires all users of measuring instruments to conduct measurements and operate measuring instruments in such a manner that the accuracy of the measurement results is guaranteed.
Taking into account the market roles under the Metering Point Operation Act, a distinction is made between the following groups:
- Meter Users
- Meter users are metering point operators as defined by the Metering Point Operation Act.
- Measurement Value Users
- Measurement value users are individuals or organizations that record measurements, pass on measurement values to authorized third parties, and handle billing for energy supply and grid usage.
Metering device users are obligated to ensure that measurement value users are made aware of the following requirements.
Transparency of Use
The measurement value user must be able to clearly explain to electricity customers how the billed active energy and, if applicable, reactive energy values are calculated.
Transparency means that customers can understand the items on their electricity bill using the meter readings relevant under metrology law.
In particular, the following information must be provided:
- Which displayed measurement values may be used for billing purposes.
- That values not displayed may not be used for billing purposes.
- That displayed values originating from functions not relevant to metrology serve exclusively for informational purposes and may not be used for billing.
In addition, the devices must be used in such a way so that electricity customers can clearly read both the meter readings relevant for billing and any error messages at any time.
Tariffing
For the use of meter reading sequences in compliance with metrology laws, only the tariffs T1 and T2 may be used.
In doing so, the requirements of § 33 MessEG must be observed.
The user of the meter readings must ensure that invoices, insofar as they are based on meter readings, can be easily understood and verified by the invoice recipients. If necessary, suitable tools must be provided for this purpose.
It must be ensured at all times that all registers used for billing are also displayed on the meter's screen.
14.2. Error Messages / Time Adjustments
Error Messages
The accompanying documents describe the device malfunctions that can be themselves. 14.2. Error Messages / Time Adjustments Error Messages The accompanying documentation describes the device malfunctions that can be detected and displayed by the meters themselves. If one or more of the events designated as "metering-law
If one or more of the events designated as "metering-law-relevant error messages" occur, the device's compliance with metering laws is no longer guaranteed. In this case, the stored measurement values must be considered unreliable.
The affected devices must be removed, repaired if necessary, and re-calibrated, provided they are to continue to be used for billing purposes.
Time Adjustment
For meters with a remotely controllable internal clock, technical measures must ensure that any change to the time relevant to measurement and billing accuracy can be traced.
For Hyperion meters, this is implemented as follows :
- Any change to the meter clock via one of the available communication interfaces generates an entry in the calibration log.
- The recording period in progress at the time of the time change is marked as invalid.
- The recording period restarted after the time change ends at the next integer multiple of the set registration period length—for example, at minute 00, 15, 30, or 45, relative to the newly set time.
Use of Communication Interfaces
The meters' communication interfaces do not comply with metrology regulations.
Measurement values read via these interfaces may be used for billing purposes only to the extent that to the extent that they represent an unchanged repetition of the measurement results displayed on the screen. The provisions of the Measurement and Calibration Ordinance, Annex 2, Section 8.1, are decisive in this regard.
Time Synchronization
The meters mentioned can be synchronized via the existing communication interfaces.
To ensure that meter reading procedures meter reading transactions, the operator must ensure that the meter's internal clock is synchronized with the legal time.
Before transmitting the date and time, the specified prerequisites must be met:
- The M-Bus must be available for communication.
- The Ethernet connection must be available for communication.
- Legal time must be used as the time source.
If these requirements cannot be met, the meter reading operations must not be used for billing-related purposes.
Measurement results that must not be used for billing purposes
Measurement values other than those listed in the type examination certificate may not be used for billing purposes.
Logbook Function
The meters mentioned have a metrological logbook. This can only be deleted by bypassing the manufacturer's access protection.
Hyperion
The following describes the menu items of the Hyperion energy meter relevant to load profile operation.
The load profile of the Hyperion energy meter is certified according to PTB-A 50.7. For the LP version of the Hyperion energy meter, the following information applies regarding tariff switching, time synchronization, transformer parameters, and the S0 pulse output.
Current and Voltage Transformer Ratios
The set current and voltage transformer ratios determine the factor applied when measuring energy quantities. The values must be set according to the current and voltage transformers used.
Changes to the current transformer and voltage transformer ratios can only be made using the SRVC button. The SRVC button can be secured against unauthorized access with a seal.
Real-time clock
The real-time clock displays the currently valid device time.
If automatic time synchronization , the use of UTC time is recommended, as automatic daylight saving time adjustment is not supported.
Changes to the real-time clock can be made using the SRVC button. The SRVC button can be secured against unauthorized changes with a seal.
S0 Pulse Output
The S0 pulse output can be configured for different types of energy:
- Active energy diff: All active energy, regardless of whether it is consumption or supply, is output together.
- Reactive energy diff: All reactive energy, regardless whether it is consumption or supply, is output together.
- Active Energy Import: Only consumed active energy is output via the S0 output.
- Reactive Energy Import: Only consumed reactive energy is output via the S0 output.
- Active Energy Export: Only supplied active energy is output via the S0 output.
- Reactive Energy Export: Only supplied reactive energy is output via the S0 output.
The S0 output generates an electrical pulse for the set amount of energy. These pulses can be used to calculate the amount of energy transmitted.
The following parameters can be configured:
- Pulse value: Number of pulses output per unit of energy.
- Pulse duration: Duration of a single pulse.
The settings for the S0 pulse output can be changed only using the SRVC button.
The SRVC button can be protected against unauthorized changes by means of a seal.
Use for Billing Purposes
For the LP version of the Hyperion energy meter, only active energy measurements are approved for billing purposes.
These readings can be retrieved at any time via the display or the respective device interface.
All other measured values shown on the display are for informational purposes only and must not be used for billing purposes.
This also applies to measured values that can only be read via interfaces and are not shown on the display.
Description
The load profile function according to PTB-A 50.7 consists of two subfunctions:
- Load Profile Memory
The load profile memory records measured values and is designed as a circular buffer. Once the maximum storage capacity is reached, the oldest entries are overwritten. For technical reasons, overwriting occurs in groups of 27 data records each. - Logbook Memory (Metrological Logbook)
The logbook documents all changes to parameters that affect the load profile recording.
The logbook memory cannot be tampered with without damaging the existing seals.
The following changes are logged:
- Changes to the date and time
- Changes to the voltage transformer or current transformer ratio
- Changes to the S0 pulse polarity
- Changes to the S0 pulse duration
Within a load profile interval, each of these parameters can be changed only once. Further changes are possible only after the start of the next recording interval.
The logbook has a maximum capacity of 2,048 entries. These entries cannot be deleted or overwritten.
If the storage capacity is exhausted and a further change is subsequently made to one of the logged parameters, the meter enters a state that is invalid under metrology regulations.
This is indicated by the symbol PTB NV on the display. In addition, all subsequent load profile entries are assigned the status NG (invalid).
For legal reasons, the status PTBNV cannot be reset or reversed.
Recording Interval
The load profile recording interval is fixed at 15 minutes for the LP versions of the Hyperion energy meter and cannot be changed.
Time Synchronization
Time synchronization is performed via a defined command using the M-Bus or TCP/ IP interface, via a time server recognized under metrology law that provides legal time, or directly via the meter's control buttons.
In this process, the date and time are transmitted to the meter. Synchronization is performed immediately and, when synchronized via the M-Bus interface, is confirmed with an ACK message.
The time can only be synchronized or set once per 15-minute recording period. Legal time must always be used.
A distinction is made between time synchronization and time setting:
- Time synchronization: Any time setting with a deviation of less than 9 seconds from the previously valid time is considered normal synchronization. In this case, no log entry is created.
- Time setting: If the real-time clock is set for the first time or if the deviation from the previous time exceeds 9 seconds, a log entry is generated and the current load profile is marked with the status
NG.
The internal buffer (power reserve) for maintaining the system time during a power outage lasts for at least 18 days, provided the meter has been in operation for at least two hours beforehand.
The Hyperion LP has internal timestamps that are reset each time the real-time clock is synchronized. If the meter is powered back on after more than two weeks without power, the system detects the missing required synchronization and marks all subsequent load profile entries as NG (invalid).
The messages TNV, TNS or NTP appear on the display. The following figure shows under which conditions these messages are displayed and what effects they have on the validity of the measured values.
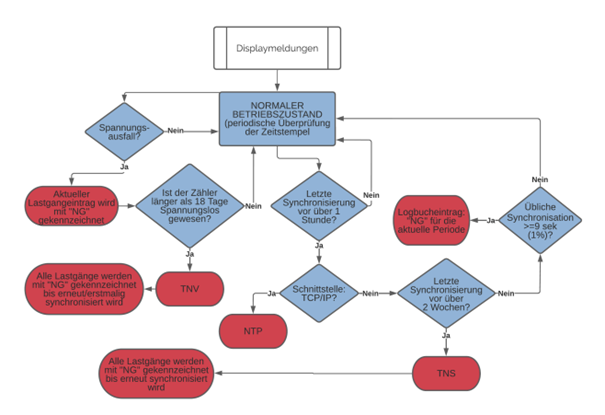
According to PTB-A 50.7, devices with a communication interface must undergo time synchronization at least once every 14 days.
If no synchronization occurs within this period, all load profile entries will be marked with NG after 14 days have elapsed, until a valid synchronization is performed again.
In addition, the message TNS appears on the display.
By default, the real-time buffer (RTC Buffer) of the Hyperion LP is uncharged and is therefore initially treated as "de-energized for more than 18 days" (TNV) .
Tariff Change
For the LP version (PTB-A 50.7 certified) a tariff change is not applied until the start of a new recording period.
The tariff applied to terminals 9 through 11 at the start of the interval remains valid until at least the start of the next recording period.
For the LP version, only dual-tariff operation is available.
The tariff is switched via the tariff inputs on the back of the meter (terminals 9 through 11).
After a power outage, an incorrect rate may be temporarily displayed during the first recording interval.
This interval is always marked with NG. The correct tariff setting is then applied from the tariff inputs NE, E1, and E2.
For the load profile according to PTB-A 50.7, only dual-rate operation is available. Rate changes take effect only at the next recording interval.
External Interface Readout
Readouts via the external interface can be used for billing purposes.
The interfaces provide the same billing-relevant information that is also displayed on the device's screen.
Storage Capacity
The internal memory offers the following capacities:
- Continuous load profile recordings: 105,378 entries
With a load profile interval of 15 minutes, this corresponds to a period of approximately three years.
S As soon as the maximum storage capacity is reached, the meter overwrites the oldest entries in batches. In this process, the first 26 entries are deleted and replaced by new data records.
Thus, the most recent 105,352 load profile entries are available at all times, while older data records are lost.
- Logbook entries: 2,048 entries
Every change to the current transformer ratio, the voltage transformer ratio, the real-time clock, or the S0 pulse polarity or pulse length generates an entry in the calibration log.
Once all available log entries have been used up, any further change to one of these parameters puts the Hyperion into a state that is invalid for calibration purposes in accordance with the requirements of PTB-A 50.7. state. The device may no longer be used for billing-related applications and must be replaced.
14.3. Power Outage and Restart
Power Outage
All load profile values are stored at fixed 15-minute intervals, i.e., at XX:00, XX:15, XX:30, and XX:45. After a power outage, recording resumes accordingly.
Example:
- Current time: 7:37 a.m., last saved entry at 7:30 a.m.
- Power outage until 8:12 a.m.
- The next entry is made at 8:15 a.m. and is automatically marked as
NG. - The entries for 7:45 a.m. and 8:00 a.m. are missing.
After every power outage, the first load profile entry is marked with the status NG (not valid).
If the internal power reserve was able to maintain the time during the outage, the subsequent load profile entries are not marked as invalid.
Restart
In rare cases, an internal restart of the meter may occur. In this case, the affected load profile entry is marked with the status NG.
Load Profile Display
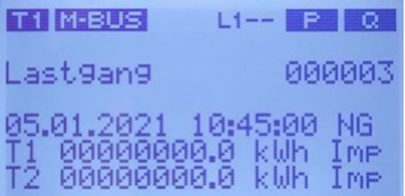
When the load profile display is opened, the most recently saved entry is always shown.
If all 105,378 available load profile entries are occupied, Hyperion automatically deletes the oldest 26 entries. The sequential numbering is not reset in the process.
Example:
If a Hyperion has already stored 200,000 load profiles, entry 200,000 is initially displayed when the screen is opened. After scrolling back 105,378 entries, the display jumps back to the most recent data records. In this case, the oldest entries have already been overwritten.
The following information is shown on the display:
- 000003: Index of the displayed entry.
- January 5, 2021 10:45:00: Timestamp of the stored load profile.
- NG: Indicates an invalid load profile entry.
- T1 / T2: Associated rate plan.
- 00000000.0 kWh: Meter reading of the active energy register at the time of recording.
A load profile entry is marked as NG (not valid) if:
- relevant device parameters have been tampered with,
- it is the first load profile after a reboot or power outage,
- no time synchronization has been performed within the last two weeks.
Valid load profile entries are displayed without any additional marking.
For load profiles according to PTB-A 50.7, only dual-rate operation is available. Tariff changes are not applied until the next recording interval.
Imp / Exp refers to switching between the consumption and supply registers.
By pressing and holding the "Down Arrow" key (> 2 s), you can switch between import (consumption) and export values (delivery).
Logbook Display
When the logbook display is called up, the most recently generated entry is always shown. The display shows the relevant information for the respective logbook entry.
In the case of a time entry
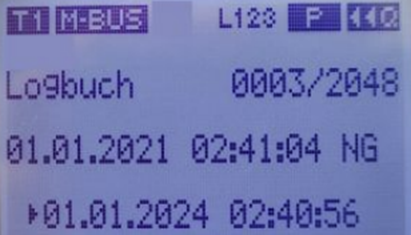
- 0003 / 2048: Index of the current logbook entry. The entries start with index 1 and can be pressing the "Down Arrow" in chronologically descending order.
- January 1, 2021 2:41:04 a.m.: Previously valid time. This value also corresponds to the time of the previous time setting.
- January 1, 2024 2 :40:56: Newly set time.
- By briefly pressing (< 1 s) the "Down Arrow" button " button, you can navigate through the stored logbook entries. The display always starts with the most recent entry.
- By pressing and holding (> 2 s) the "Down Arrow", you can switch between the logged changes and the corresponding meter readings at the time of the change.
In the event of a change to a conversion factor
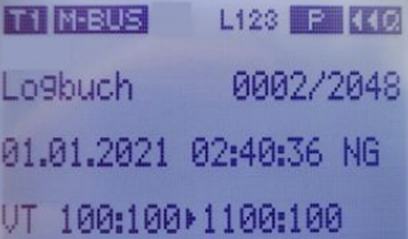
- 0002 / 2048: Index of the current log entry.
- January 1, 2021 2:40:36 AM: Time of the change.
- VT 100:100 → 1100:100: The previous voltage transformer factor is shown on the left, and the newly set factor on the right.
- With a brief press (< 1 s) of the "Down Arrow" button, you can navigate through the saved logbook entries.
- By holding down (> 2 s) the "Down Arrow" button, you can switch between the change view and the meter readings at the time of the change .
In the event of a change to the pulse duration
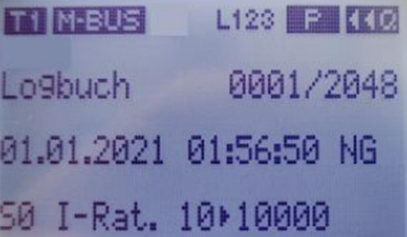
- 0004 / 2048: Index of the current log entry.
- January 1, 2024, 2:41:40 AM: Time of the change.
- S0 I -Dur. 120 → 30: The previous pulse duration is shown on the left, and the newly set pulse duration in milliseconds is shown on the right.
- By briefly pressing (< 1 s) the "Down Arrow", you can navigate through the saved logbook entries.
- By pressing and holding (> 2 s) the "Down Arrow" button, you can switch between the change information and the meter readings saved at the time of the change.
In the event of a change to the pulse value
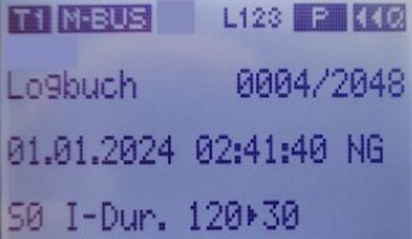
- 0001 / 2048: Index of the current log entry. Entries start with index 1 and can be scrolled through in chronologically descending order by pressing the "Down Arrow" key.
- Jan. 01/2021 01:56:50: Time of the change.
- S0 I-Rate 10 → 10000: The previous pulse value is shown on the left, and the newly set pulse value in pulses per kWh is shown on the right.
- Pressing the "Down Arrow" button briefly (< 1 s) allows you to navigate through the stored logbook entries. The display always starts with the most recent entry.
- By pressing and holding (> 2 s) the "Down Arrow" button, you can switch between the edit view and the meter readings saved at the time of the change.