Juno TH TILT mioty® Blueprint – IFM Gateway Integration
mioty® Blueprint – IFM Gateway Integration
1. Version History
| Version | Date | Revision |
|---|---|---|
| 1.0.0 | April 30, 2026 | Created |
2. Integration of Blueprint Sensors into the ifm mioty Gateway
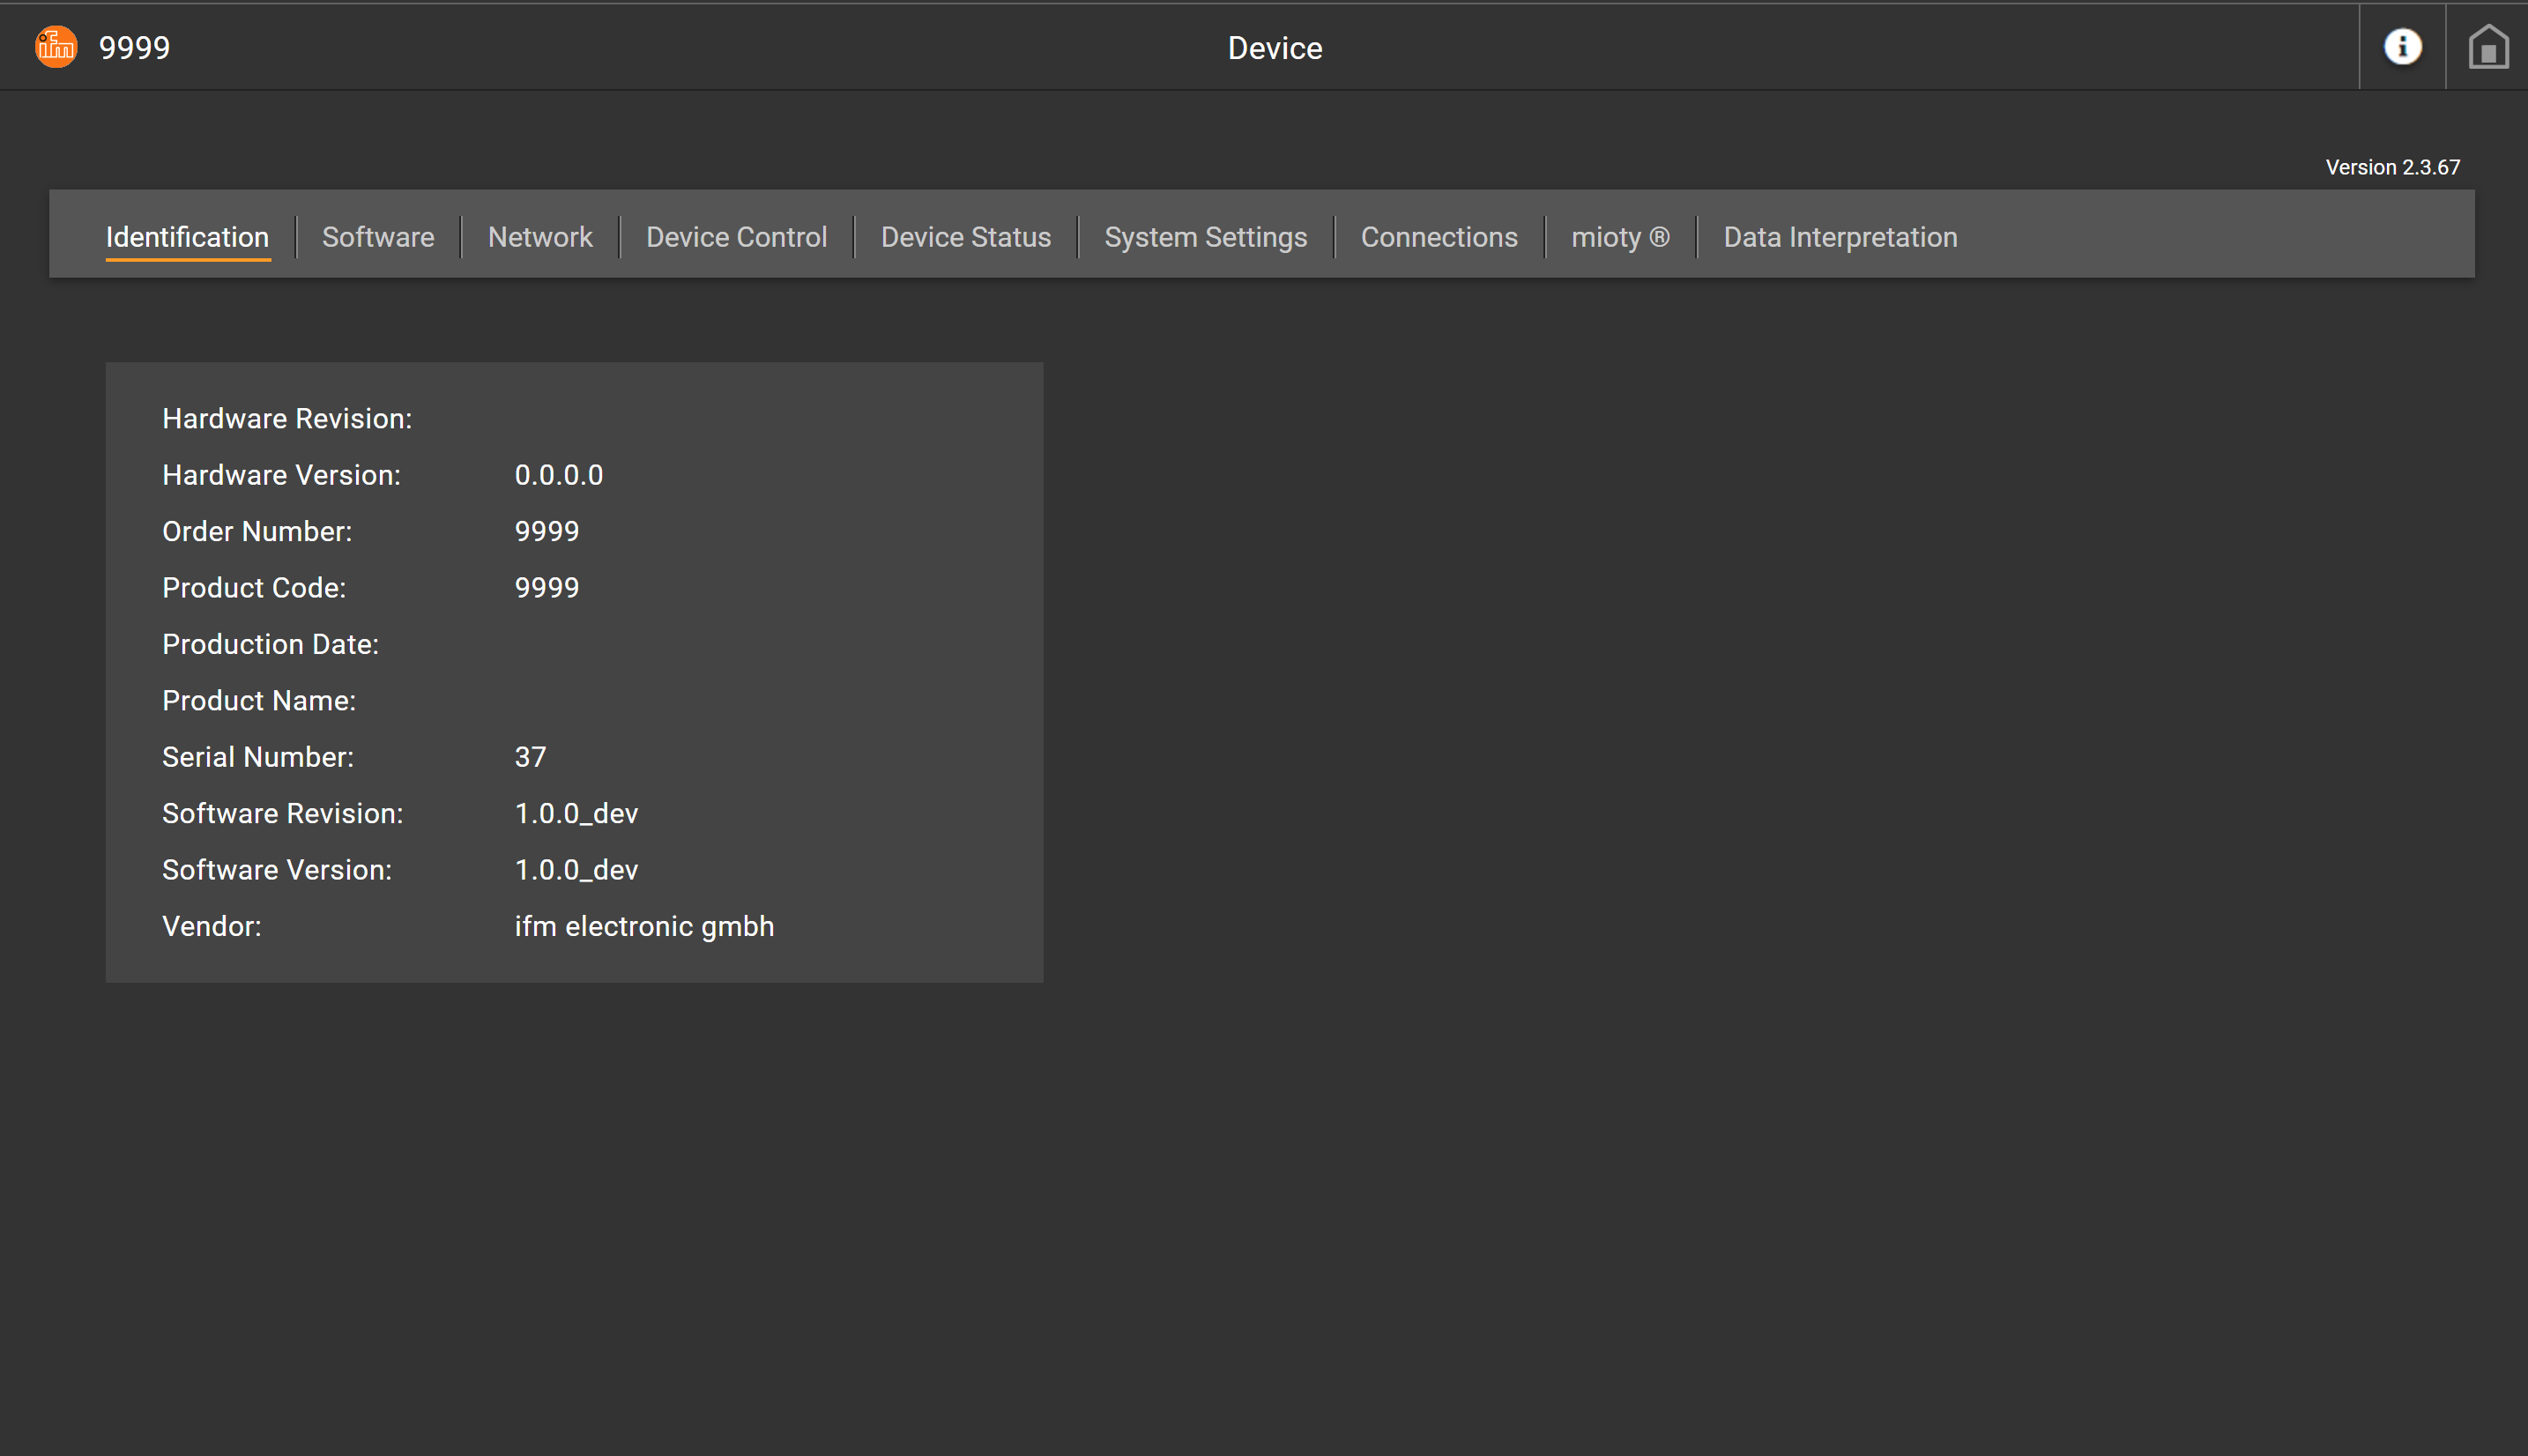
Step 1
Commission the gateway. Follow the instructions provided by ifm. You should see the following screenshot below.
Step 2
Navigate to the "Data Interpretation" tab and then to the "Blueprint" tab.
.png)
Step 3
Download the Blueprint for your selected sensor. To do this, go to https://docs.sentinum.de and search for your sensor and the corresponding Blueprint. In this case, we are setting up a Juno temperature and relative humidity sensor.
.png)
Step 4
Click on the entry and then click the JSON File button. Alternatively, a .txt file can be downloaded further down.
.png)
Step 5
The blueprint should now open. Right-click to save this file to a folder using Save As.
.png)
Step 6
Now return to the gateway interface. Click on the "Data Interpretation" tab and then on the "Blueprint" tab, and click the "+ Add New..." button. Upload the saved blueprint file as a .json file.
.png)
.png)
Step 7
You should now see a newly created blueprint, in this case Juno. An EUI is automatically assigned to the blueprint. Copy and save this EUI because we will need it again later.
.png)
Step 8
Let us now integrate the sensor. Navigate to the mioty tab on the gateway interface and click "+ Attach New".
.png)
Step 9
The following window will now appear. Click the "Blueprint" checkbox at the top so that you see the "Blueprint EUI" input field at the bottom. Enter the required information here and then click "OK". You can find this in the packaging as a QR code, or you can request it conveniently as a .csv file at info@sentinum.de. Important: You will need the Blueprint EUI again for this step.
.png)
.png)
Step 10
You have now successfully added the sensor.
.png)
Step 11
You should now see the sensor with all the necessary information.
.png)
Step 11
Activate the sensor now using a magnet or NFC. Wait a short moment, then click the "Refresh" button. You should then see the following values.
.png)
.png)
.png)
Step 12
By clicking on the graph on the right in the Actions column, you can view the sensor values.
.png)
© Sentinum GmbH - All rights reserved.
All contents of this document, including text, tables, and images, are protected by copyright and are the property of Sentinum GmbH.
All images are subject to the copyright of Sentinum GmbH unless otherwise stated.
Reproduction, distribution, or use, even in excerpts, is not permitted without explicit written permission.
Specifications are subject to change without notice. All information is provided without warranty.